Debug Service
The Cangjie programming language provides a visualized debug service for developers to debug Cangjie programs. This plug-in provides the following functions:
- Launch: starts the debugging process.
- Attach: attaches to a started process.
- Supports source code breakpoints, function breakpoints, data breakpoints, and assembly breakpoints.
- Supports single-step debugging in source code, run to cursor, step-in, step-out, continue, pause, restart, and stop debugging.
- Supports Cangjie-C interoperability debug, continue Cangjie code, and step in C code.
- Supports single-step, step-in, and step-out in assembly.
- Supports expression evaluation.
- Supports viewing and modifying variables.
- Supports viewing variables on the debugging console.
- Supports viewing output information of programs to be debugged.
- Supports reverse debugging.
- Supports Unittest running and debugging.
NOTE
- If you use the VSCode debug service for the first time, see the VSCode Debug Service User Guide.
- Currently, the debug service can be installed and used in VSCode of the Windows and Linux versions.
- Restricted by the debugger, if a conditional breakpoint exists in the loop code, the PAUSE operation may cause subsequent debugging to fail.
- Modifying variables in the VARIABLES view does not trigger update of the variables that have dependencies.
- If the debug service depends on the liblldb file in the Cangjie SDK package, you need to configure the Cangjie SDK path in advance.
- The debug plug-in client communicates with the server through Socket. The plug-in automatically searches for an available port, beginning at port 9995, and starts the Socket server on 127.0.0.1 to listen to the port.
Starting Debugging
Launch Mode
Cangjie Project Debugging
- If the
launch.jsonfile is not created, choose Run and Debug > Cangjie(cjdb) Debug to start debugging. - If the
launch.jsonfile is created, in thelaunch.jsonfile, choose Add Configuration > Cangjie Debug (CJNative): launch > Build And Debug Cangjie Project to add debugging configurations and select the added configurations to start debugging.
Single File Debugging
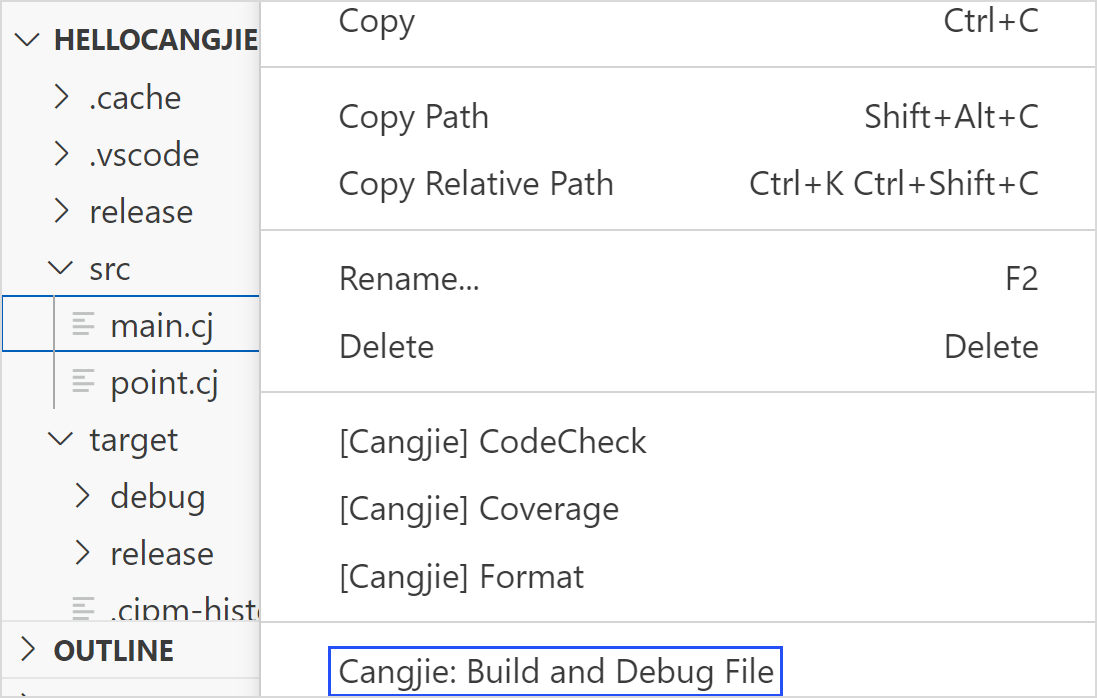
To debug a single file, right-click the Cangjie source file to be debugged and choose Cangjie: Build and Debug File from the shortcut menu. This operation generates the compilation configuration file task.json and compilation script, executes the script based on task.json configurations to compile a debuggable binary file, and then starts debugging.
Debugging a Manually Compiled Executable File
- Use the cjc compiler or cjpm to manually compile a debuggable binary file.
- Choose Run and Debug > Cangjie(cjdb) Debug > Cangjie (CJNative): launch > Choose Executable File Later to start debugging.
Debugging Macro-Expanded Code in Launch debugMacro Mode
Debug the code file (with the filename extension .marcocall) with the debug macro expanded. In this case, the original file corresponding to the macro cannot be debugged.
Debugging a Remote Process (from Linux to Linux)
During remote process debugging in launch mode, the debug service pushes the locally compiled binary file to the remote platform and then remotely debugs the binary file.
- Start lldb-server on the remote platform. You are advised to start the cjdb lldb-server in /cangjie/third_party/llvm/lldb/bin/lldb-server by running the command
/**/**/cangjie/third_party/llvm/lldb/bin/lldb-server p --listen "*:1234" --server. - Use the cjc compiler or cjpm to manually compile a debuggable binary file on the localhost.
- Click Run and Debug to start debugging.
The following is a launch.json configuration example.
{
    "name": "Cangjie Debug (cjdb): test",
    "program": "/**/**/test",
    "request": "launch",
    "type": "cangjieDebug",
    "externalConsole": false,
    "remote": true,
    "remoteCangjieSdkPath": "/**/**/cangjie",
    "remoteFilePath": "/**/**/test",
    "remoteAddress": "1.1.1.1:1234",
    "remotePlatform": "remote-linux"
}
Configuration Attributes
| Attribute | Type | Description |
|---|---|---|
| program | string | Specifies the full path of the debugged process, for example, /home/cangjieProject/build/bin/main. The file is pushed to the remote platform. |
| remote | boolean | Starts the remote launch process. The value of remote is set to true. |
| remoteCangjieSdkPath | string | Specifies the path of the remote Cangjie SDK. |
| remoteFilePath | string | Specifies the full path for storing pushed files on the remote platform. Ensure that the path /home/test/ is valid and exists. main is the name of the file pushed to the remote platform. Example: /home/cangjieProject/build/bin/main. |
| remoteAddress | string | Specifies the IP address of the host where the debugged process is located and the listen port number of lldb-server, in the data format of ip:port. |
| remotePlatform | string | Specifies the remote platform. Only remote-linux is supported. |
| env | object | Sets the runtime environment variables for the program to be debugged. This configuration overwrites the system environment variables. To add configurations to the system configuration, append ${env:PATH} to the configuration item. For example: "PATH":"/home/user/bin: ${env:PATH}", "LD_LIBRARY_PATH":"/home/user/bin:${env:LD_LIBRARY_PATH}". |
Attach Mode
Debugging a Local Process
- In the
launch.jsonfile, choose Add Configuration > Cangjie Debug (CJNative) : attach to add debugging configurations, and select the added configurations to start debugging. - In the displayed dialog box, select the process to be debugged to start debugging.
Debugging a Remote Process
- Compile a debuggable binary file on the localhost and copy the file to the remote host.
- Start lldb-server on the remote host. You are advised to start cjdb lldb-server in /cangjie/third_party/llvm/lldb/bin/lldb-server by running the command
/**/**/cangjie/third_party/llvm/lldb/bin/lldb-server p --listen "*:1234" --server. - Start the binary file to be debugged on the remote host.
- Configure the
launch.jsonfile on the localhost and start debugging.
launch.json configuration attributes:
{
    "name": "Cangjie Debug (cjdb): test",
    "processId": "8888",
    "program": "/**/**/test",
    "request": "attach",
    "type": "cangjieDebug",
    "remote": true,
    "remoteAddress": "1.1.1.1:1234",
    "remotePlatform": "remote-linux"
}
Configuration Attributes
| Attribute | Type | Description |
|---|---|---|
| processId | string | Specifies the PID of the process to be debugged. If the PID is configured, attach the PID first. If the PID is not configured, attach the program. |
| program | string | Specifies the full path of the debugged process, for example, /home/cangjieProject/build/bin/main. |
| remote | boolean | If configuration is to be attached to a local process, remote is set to false; if configuration is to be attached to a remote process, remote is set to true. |
| remoteAddress | string | Specifies the IP address of the host where the debugged process is located and listen port number of lldb-server for remote debugging, in the data format of ip:port. |
| remotePlatform | string | Specifies the remote platform for remote debugging. Only remote-linux is supported. |
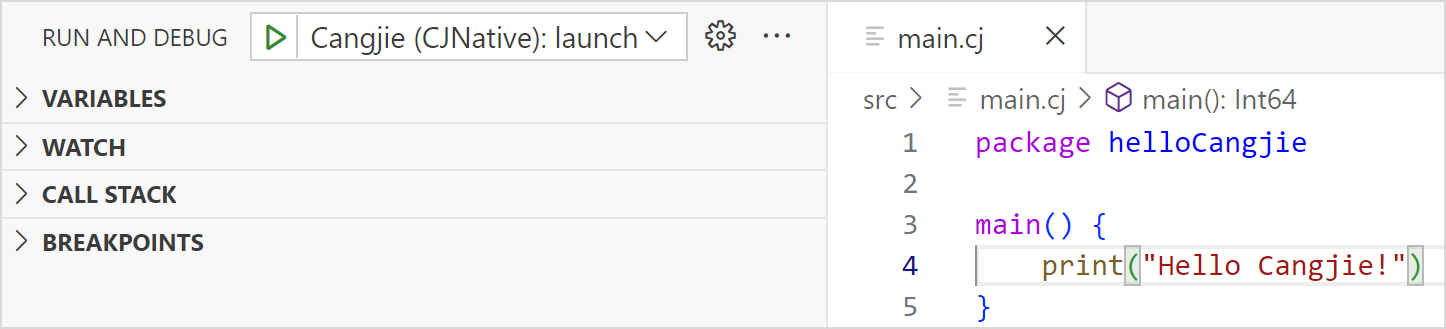
Viewing Debugging Information
When a process is in the stopped state, you can view breakpoints, current threads, stack information, and variables on the left side of the VSCode UI. You can edit breakpoints and modify variables. You can also move the cursor over a variable name in the Editor window to view the variable value. You can view the output information of the program to be debugged in the TERMINAL window.
Expression Evaluation
- In the WATCH window, click Add or double-click in the blank area, and enter an expression.
- Enter an expression in the Debug Console window.
- In the Editor window, double-click a variable, right-click the variable, and choose Evaluate in Debug Console from the shortcut menu.
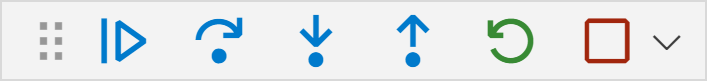
Program Control
-
Click the icons on the top debugging toolbar to control a program, including running in single step, stepping in, stepping out, continuing, pausing, restarting, or stopping the program.
-
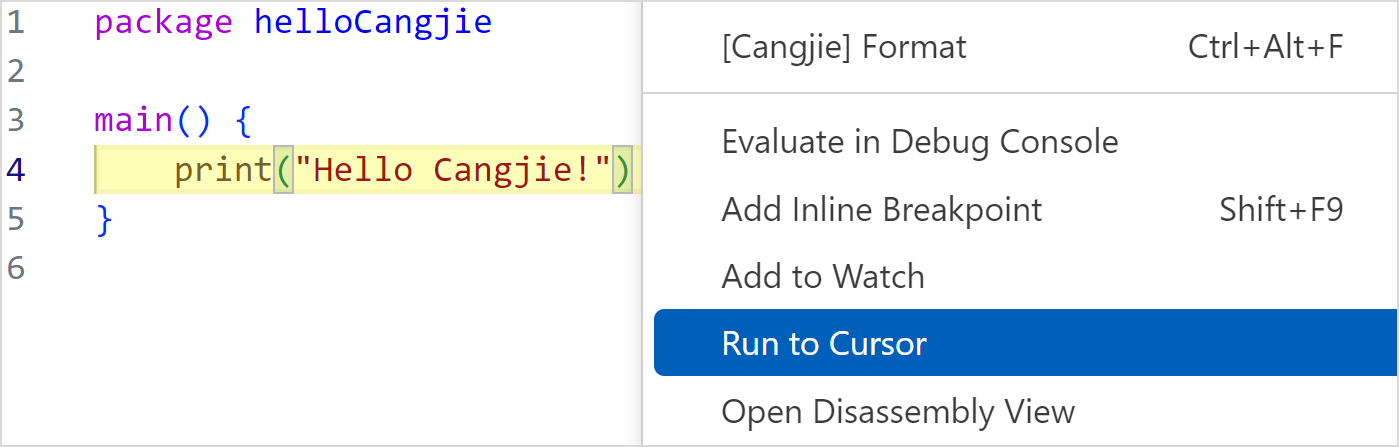
Right-click at the cursor and choose Run to Cursor from the shortcut menu.
-
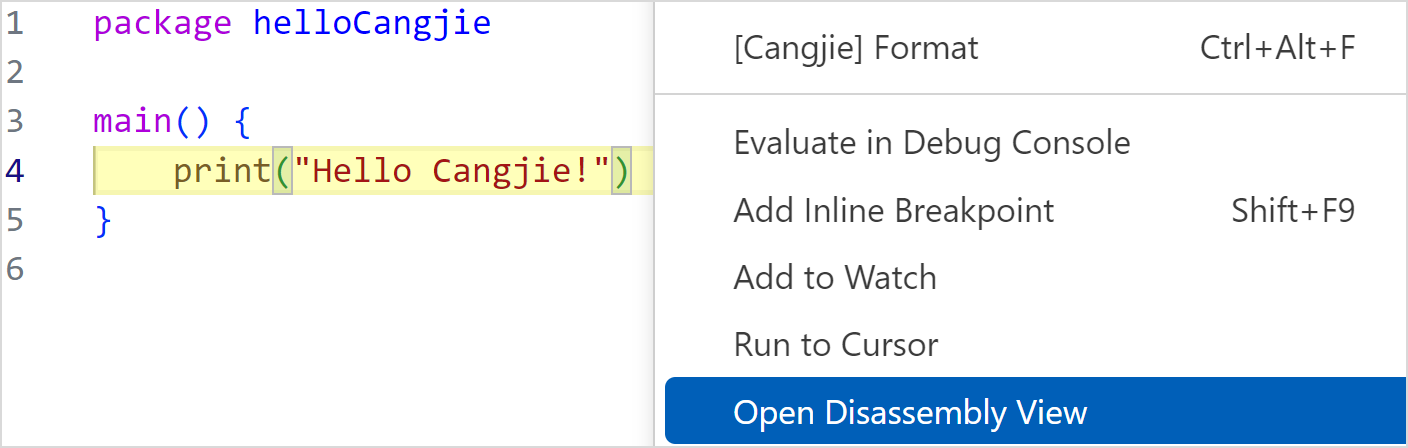
Right-click in the source code view and choose Open Disassembly View from the shortcut menu.
Debugging Console
Running cjdb Commands
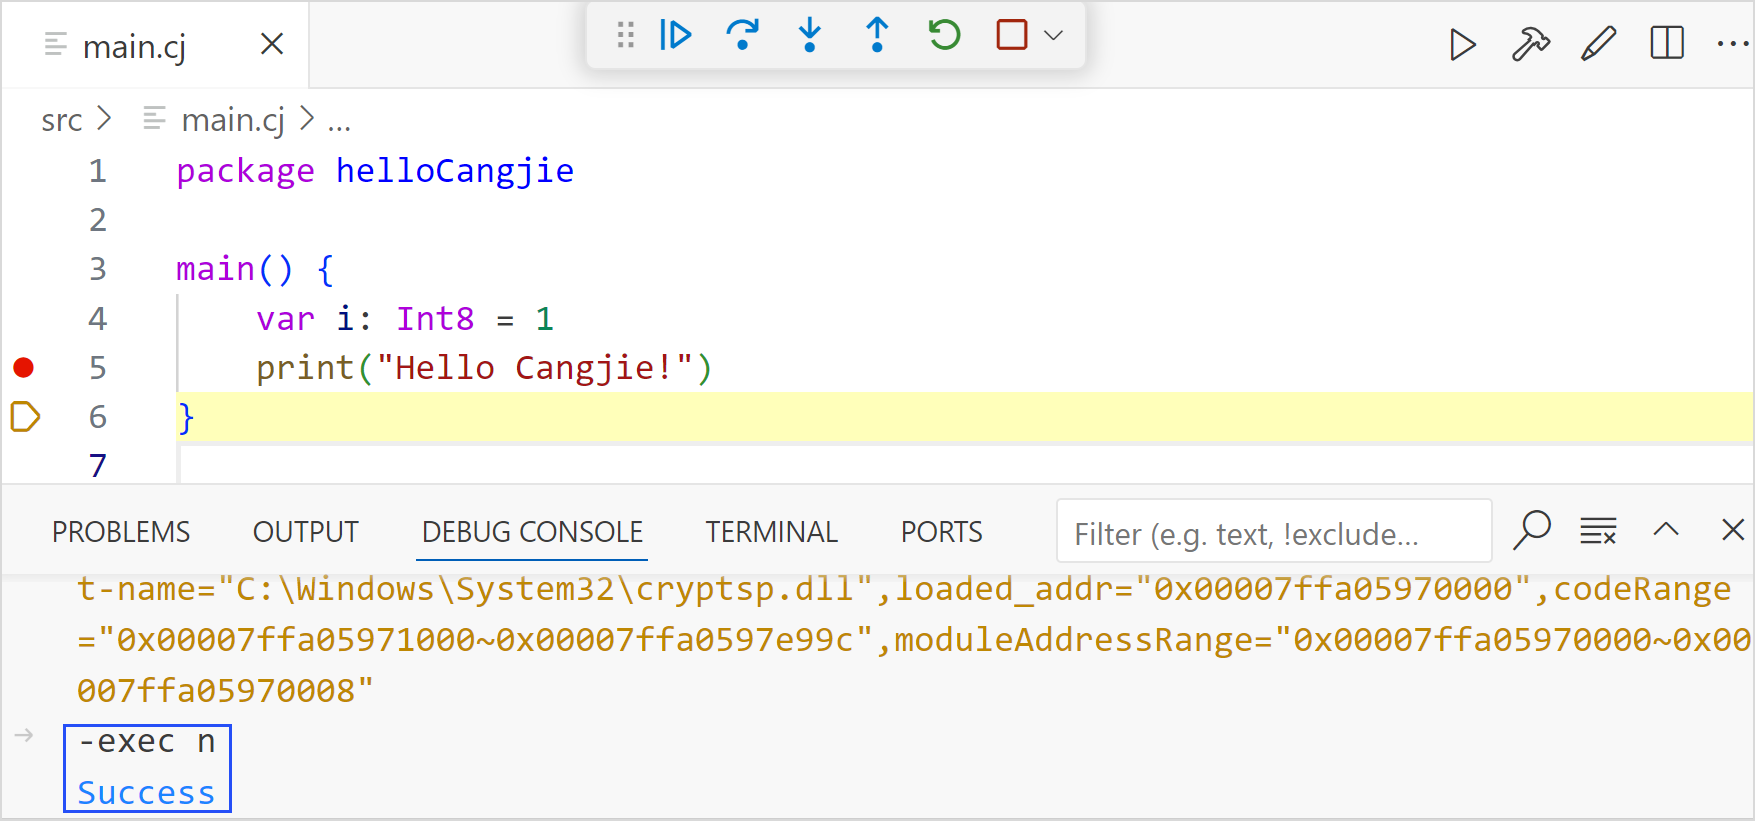
Enter cjdb commands on the debugging console to debug a program. The command needs to start with -exec. The subcommand to be executed needs to be a correct cjdb command.
The following is an example of running the cjdb command n to perform single-step debugging:
-exec n
Viewing Variables
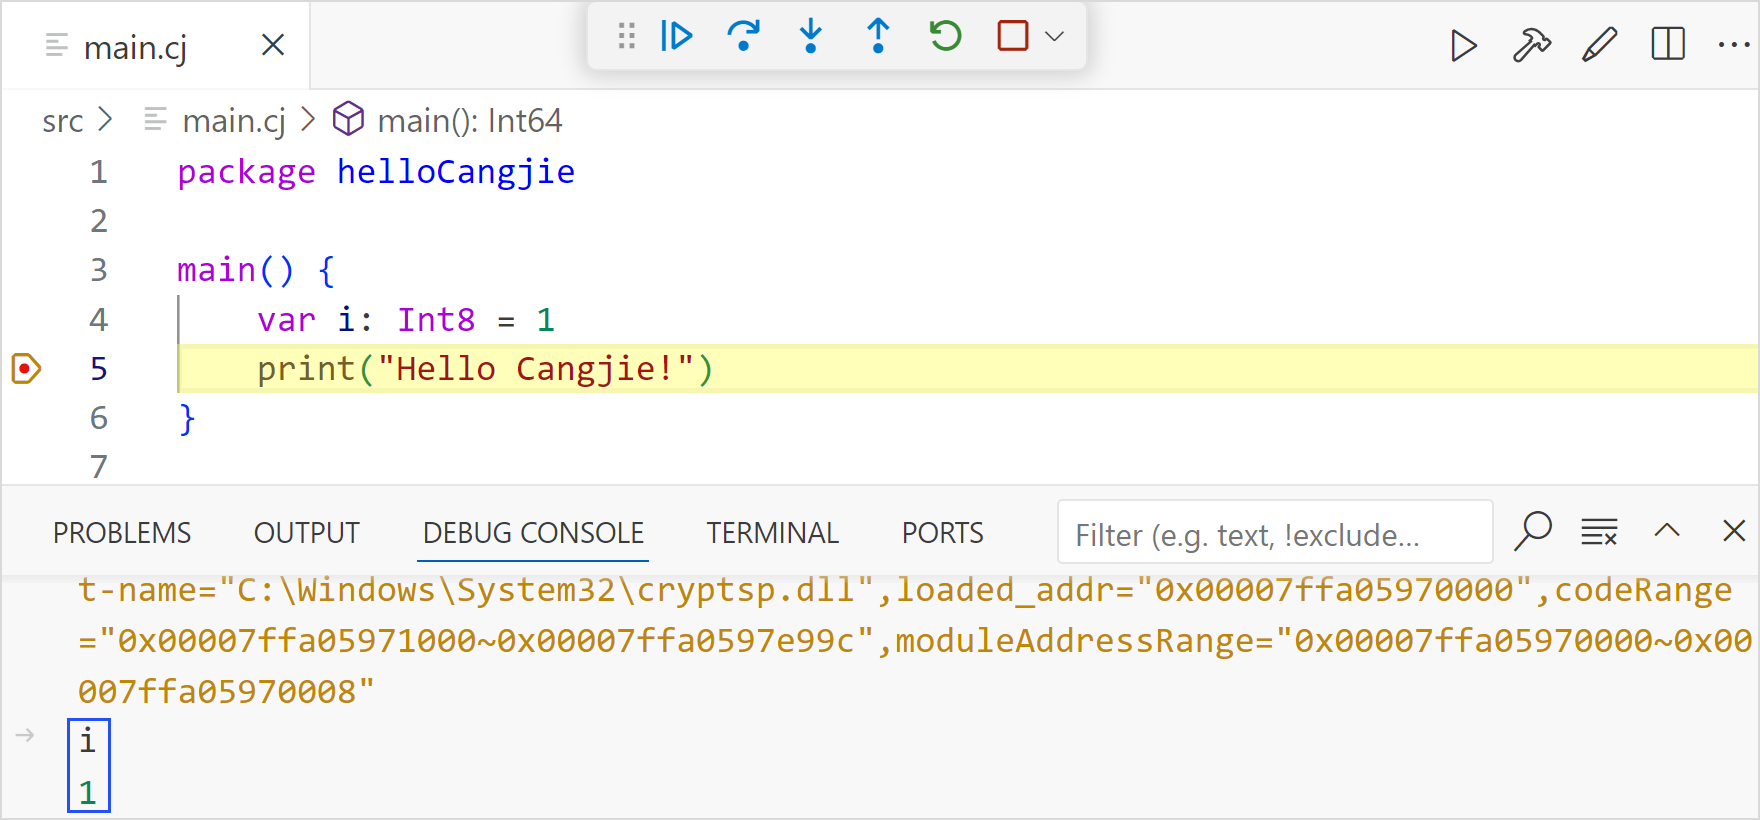
Enter a variable name on the debugging console to view the variable value.
Reverse Debugging
NOTE
- Reverse debugging is based on record replay. After the reverse debugging function is enabled, the debug service records all stop points (breakpoints and single steps) of forward debugging and debugging information such as threads, stacks, and variables at the stop points. In reverse debugging mode, you can view the debugging information of historical record points.
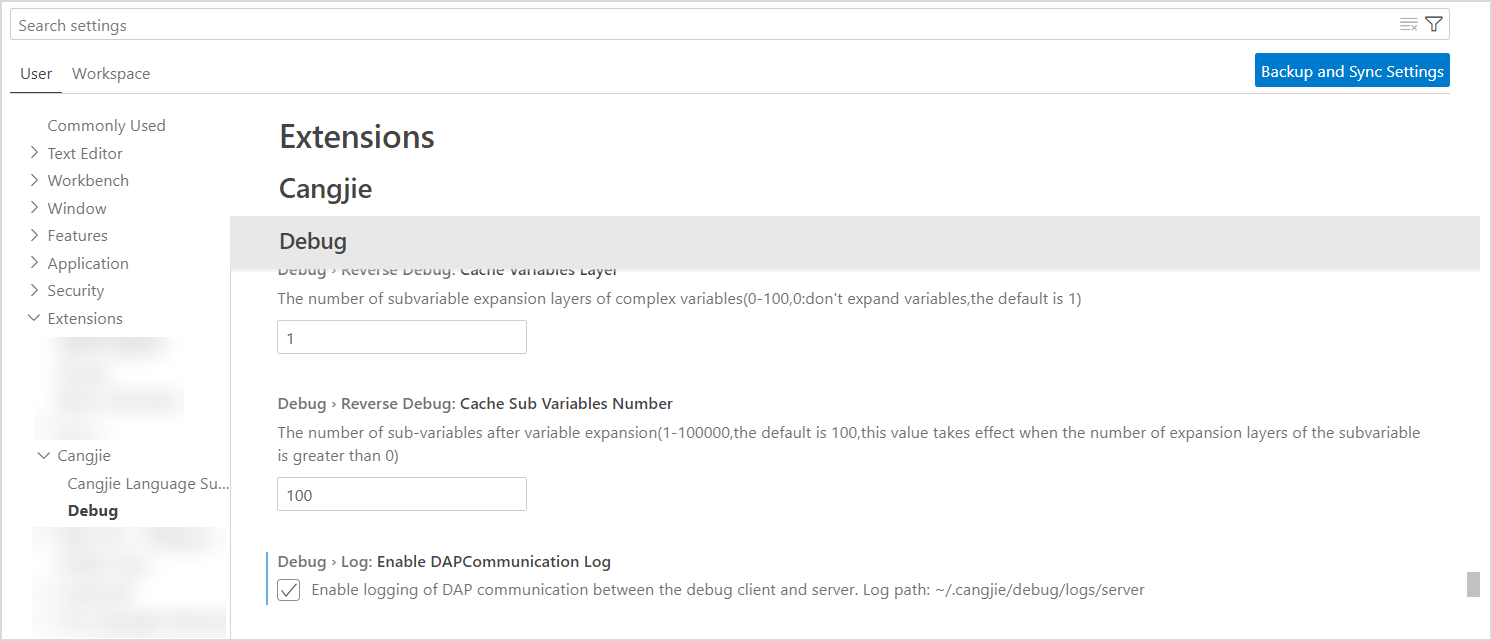
Configuration
Click the gear icon in the lower left corner, select Settings, enter cangjie in the search box, find Reverse Debug, and check Enable reverse debug to enable automatic recording of historical stop points of program debugging. In addition, you can configure the number of automatically recorded threads, number of stacks, variable scope, number of expansion layers of sub-variables of complex variables, and number of sub-variables. After the configuration is modified, restart the Cangjie debugging console.
Toolbar
Click the clock icon on the top debugging toolbar to enter the reverse debugging mode. Use the forward/reverse continue and forward/reverse single-step to control a program on the toolbar to view historical thread, stack, and variable information, as shown in the following figure.

Click the block icon on the top debugging toolbar to exit the reverse debugging mode. The debugging returns to the last stop point of the forward debugging, as shown in the following figure.

Reverse Breakpoint
NOTE
- The reverse breakpoint is a special source code log point. Forward debugging does not stop, and no log messages for logging reverse breakpoints are automatically generated during this process.
- During forward debugging, you can set a reverse breakpoint in advance. The debug service background records the debugging information of the reverse breakpoints of the process.
- In reverse debugging mode, a reverse breakpoint is used as a stop point (breakpoint type). You can view the debugging information such as thread stack variables at the breakpoint.
- In reverse debugging mode, reverse breakpoints cannot be set.
Reverse breakpoint setting mode:
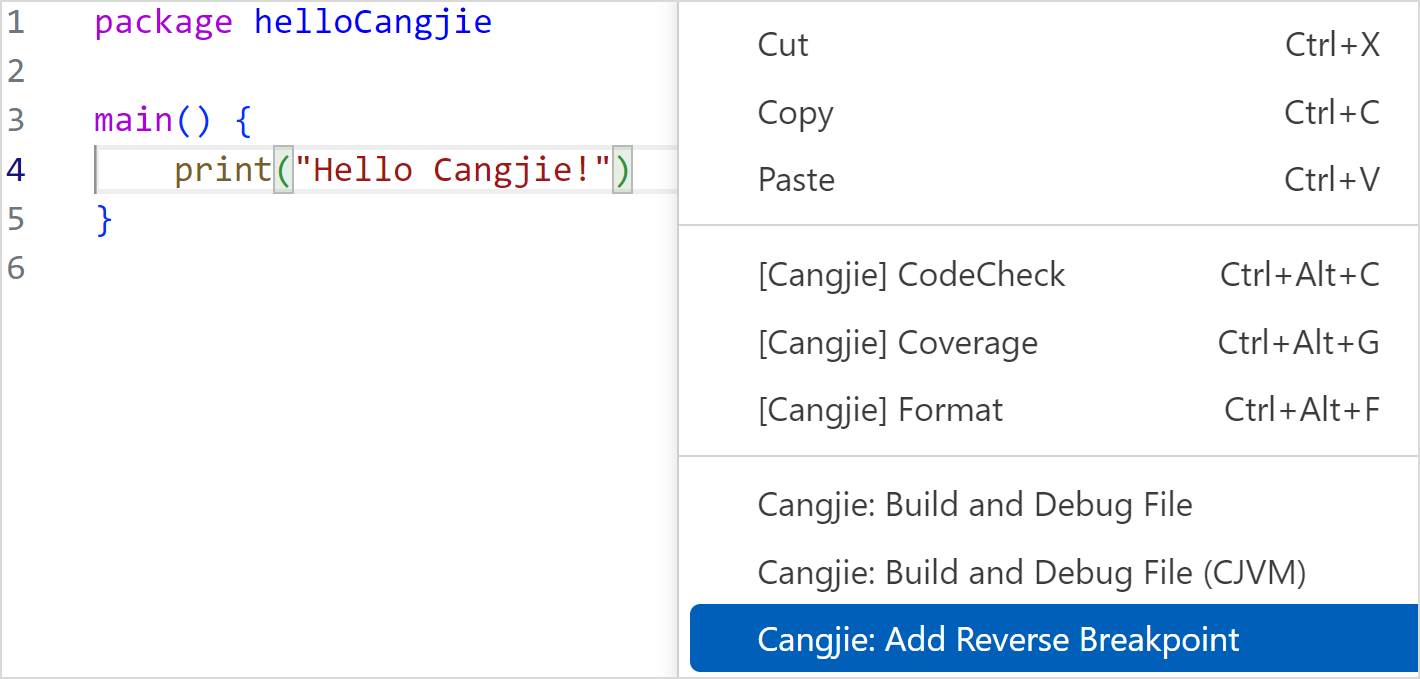
-
Right-click in the Cangjie source file editor view and choose Cangjie: Add Reverse Breakpoint from the shortcut menu to set a reverse breakpoint for the line where the cursor is located.
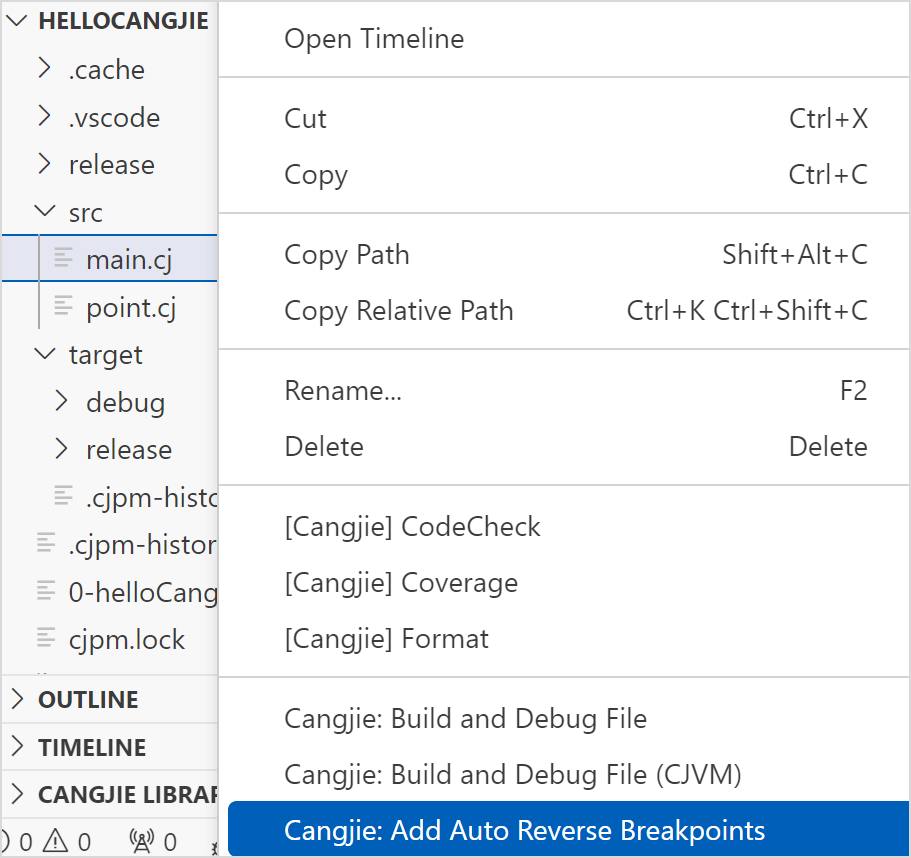
-
Right-click the Cangjie source file and choose Cangjie: Add Auto Reverse Breakpoints from the shortcut menu. The plug-in analyzes the entry and exit positions of the functions in the file and automatically sets reverse breakpoints.
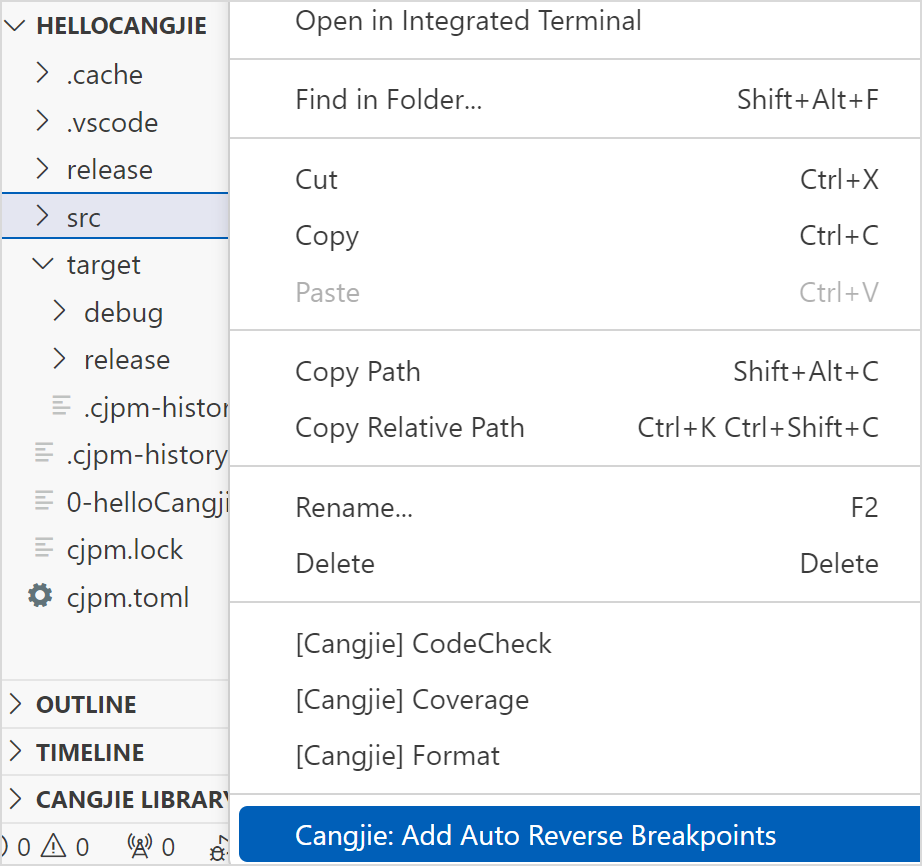
-
Right-click a folder and choose Cangjie: Add Auto Reverse Breakpoints from the shortcut menu. The plug-in analyzes the entry and exit positions of the functions in the Cangjie source file in the folder and automatically sets reverse breakpoints.
Timeline
Note:
The timeline displays all stop points (breakpoints and single steps) recorded in reverse debugging mode. You can drag the timeline to view historical stop points.
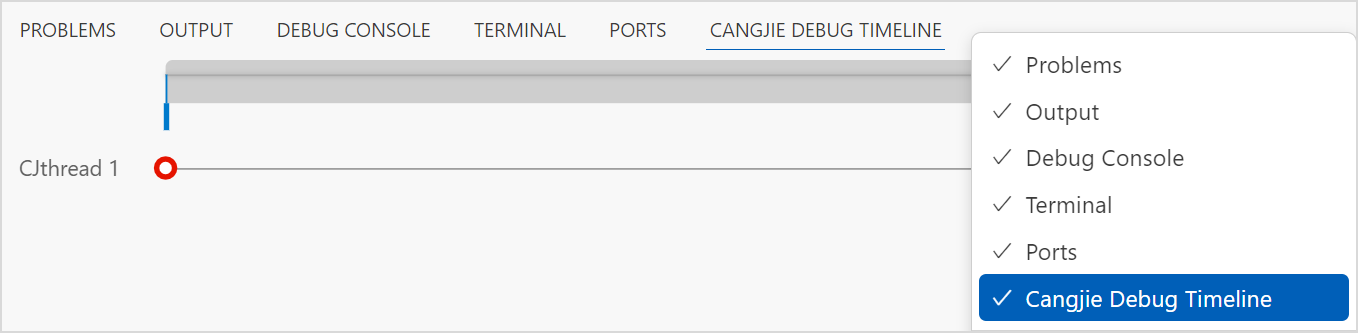
The entry of the timeline is in the lower right area of VSCode. You can right-click the tab line in the lower right area and choose Cangjie Debug Timeline from the shortcut menu to enable or disable the timeline, as shown in the following figure. You can also choose View > Open View to enable the timeline.
- There are left and right cursors on the main timeline. You can drag the left and right cursors to select a time area. After an area is selected, the cursor changes to a hand shape when it is placed above the selected area. In this case, you can drag the area leftward or rightward.
- Place the cursor on the main timeline. When the cursor changes to a cross, hold down the cursor and drag it forward or backward to set the area that the cursor is moved over to a new time area.
- You can hold down Ctrl and scroll the mouse wheel to zoom in or zoom out the selected area.
- Each timeline identifies a Cangjie thread or system thread.
When you click a record point on the timeline, the editor view is refreshed synchronously (locating the source code line), and the debugging information view is refreshed synchronously (displaying the thread, stack frame, and variables of the record point).
Running and Debugging unittest
Prerequisites
The unit test code of a module is in the following structure: The .cj file indicates the source code of a package, and the name of the corresponding unit test code file ends with _test.cj. For details about how to write the unit test code, see the standard library user manual.
├── src

│    ├── koo

│    │   ├── koo.cj

│    │   └── koo_test.cj

│    ├── zoo

│    │   ├── zoo.cj

│    │   └── zoo_test.cj

│    ├── main.cj

│    └── main_test.cj

└── cjpm.toml
How to Use
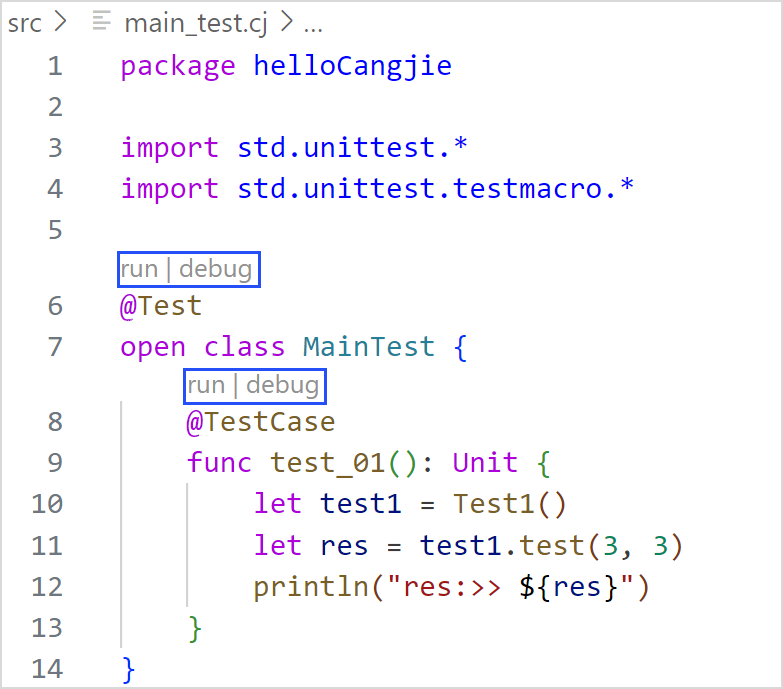
- Click the Run button on the
@Test/@TestCasedeclaration line to run the unit test class or unit test case. - Click the Debug button on the
@Test/@TestCasedeclaration line to debug the unit test class or unit test case.
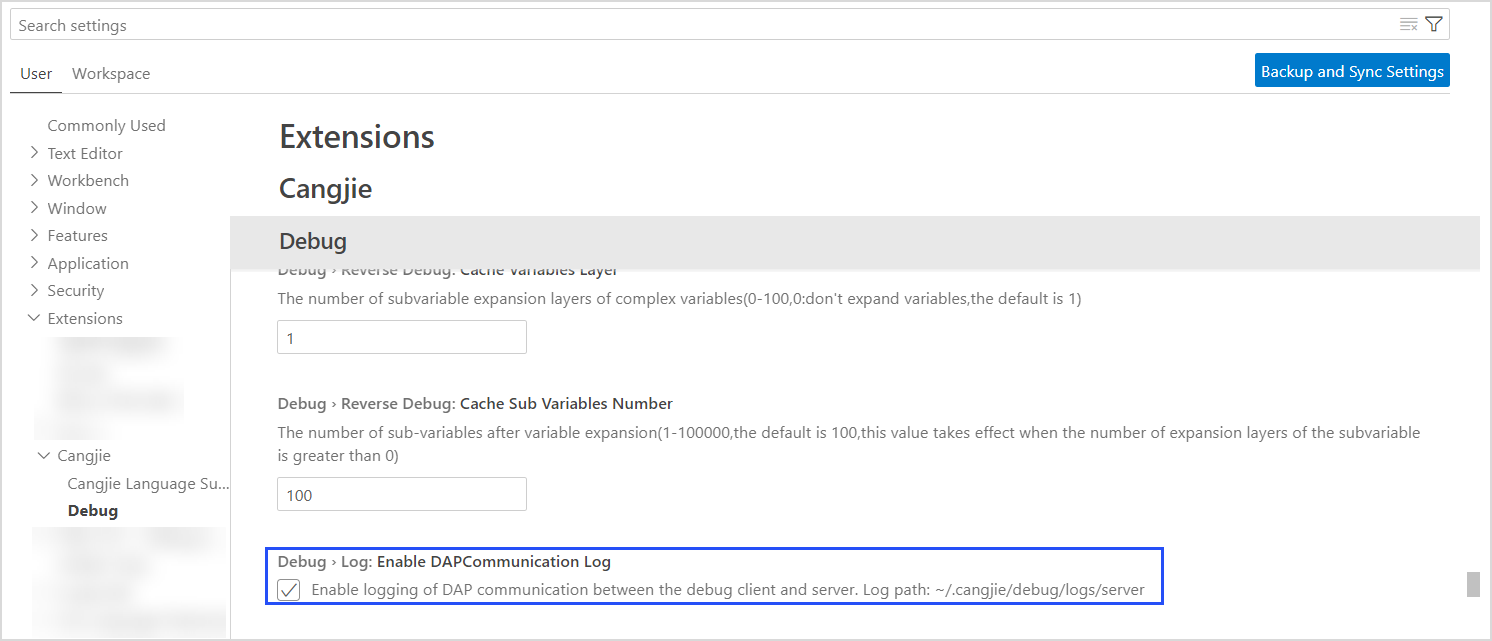
DAP Communication Logs
The client and server of the debug service communicate with each other using the DAP protocol. Communication logs can be used to locate faults. The log path is /.cangjie/debug/logs/server in the user directory.
You can click the gear icon in the lower left corner, choose Settings, enter cangjie in the search box, find the Debug option, and select Enable DAPCommunication Log to enable the debug service communication log function.