Debugger
The debugger cjdb provides source code–level debugging capabilities and supports Cangjie cross-language debugging. For example, you can enter or exit cross-language function code in single-step mode, view the complete call stack in cross-language mode, and use a single debugger to complete debugging of multiple languages. In addition, debugging of Cangjie threads is supported, further improving user debugging experience.
Cross-Language Debugging
The debugger identifies the cross-language interoperation glue code layer in the single-step process, automatically calculates addresses of target functions, and filters out glue code that users do not care about. In this way, single-step entries and exits in cross-language function calls are the same as in common function calls, and call stacks of multiple languages can be automatically combined and displayed, improving developer debugging experience. The following figures show cross-language debugging of C functions called using the Cangjie language in the IDE.
Figure 1: Cangjie -> C cross-language call
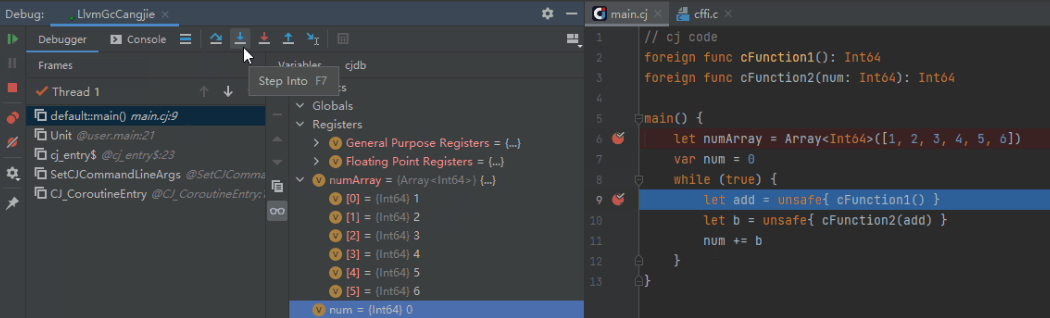
Figure 2: Cangjie -> C cross-language single-step access
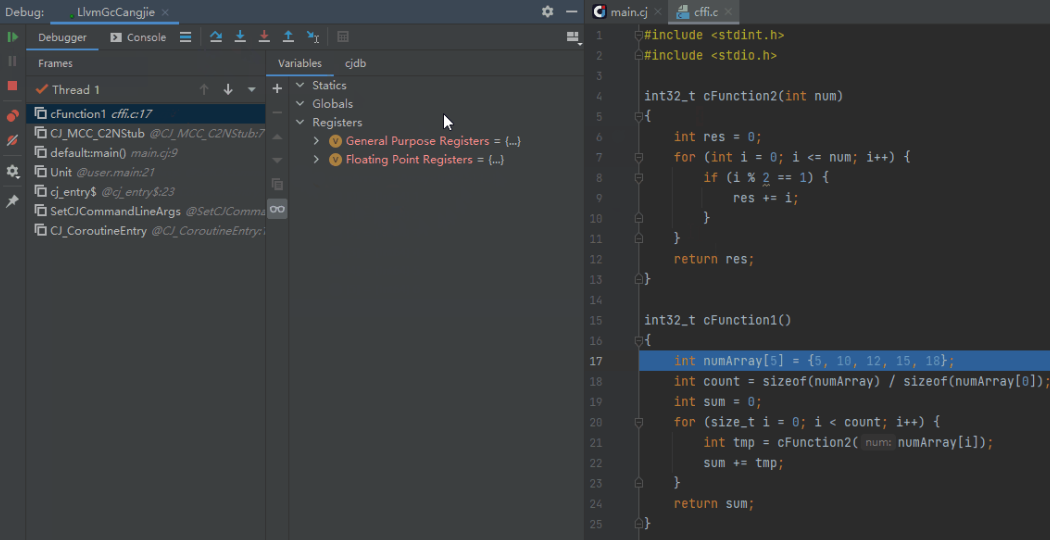
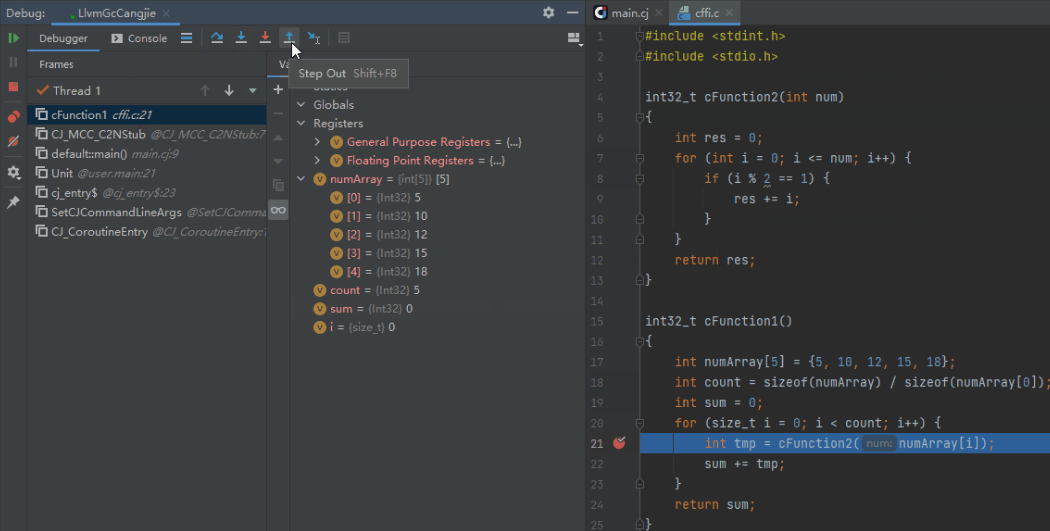
Figure 3: Cangjie -> C cross-language call stack and single-step debugging in FFI-C functions
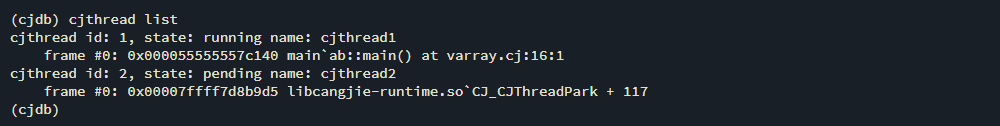
Cangjie Thread Debugging
Cangjie supports concurrent programming based on multiple Cangjie threads. When a Cangjie program is executed, Cangjie and system threads are in an M:N relationship, and the number of Cangjie threads is usually very large. Calls among Cangjie threads are asynchronous. As a result, if an exception occurs, the exception cannot be captured and processed as in a common program. The Cangjie debugger supports setting breakpoints for Cangjie threads to view call stacks.